Featured

How data is shaping Corporate Real Estate Strategies

Technology shifts

Technology and the increasing need for data is changing the real estate industry, both from an investment and management point of view. With the wealth of financial information required by institutional investors, Real Estate Managers are increasingly challenged with:

  • Demonstrating return on investment
  • Finding smarter ways to reduce costs
  • Maximise building occupancy and prove value

Whilst some businesses are embracing technology capabilities, many are still lagging behind.

Real Estate Managers are relying on hard data to inform strategic decision making, future property investments and go beyond traditional approaches of twice yearly manual counting or gut feel. Real estate is the second largest cost to all organisations of any size – the need for managing it using evidence is indisputable.

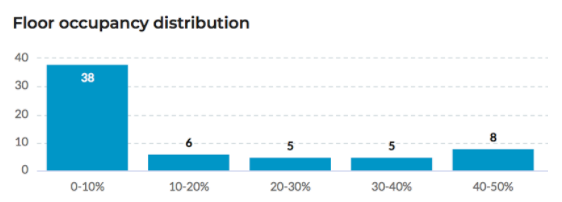
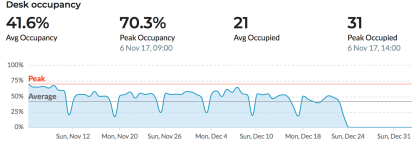
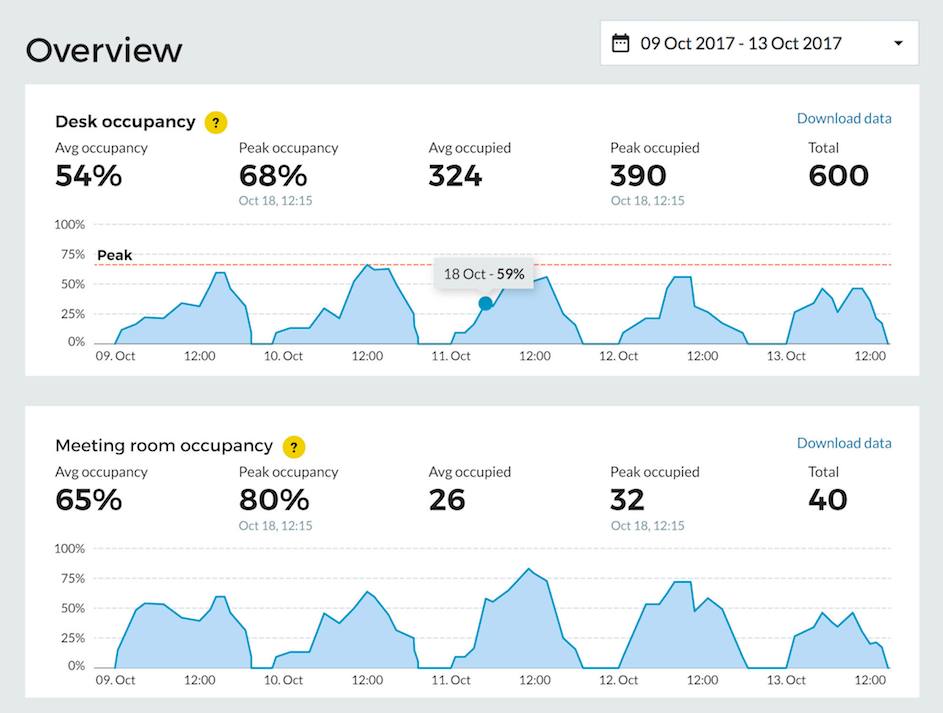
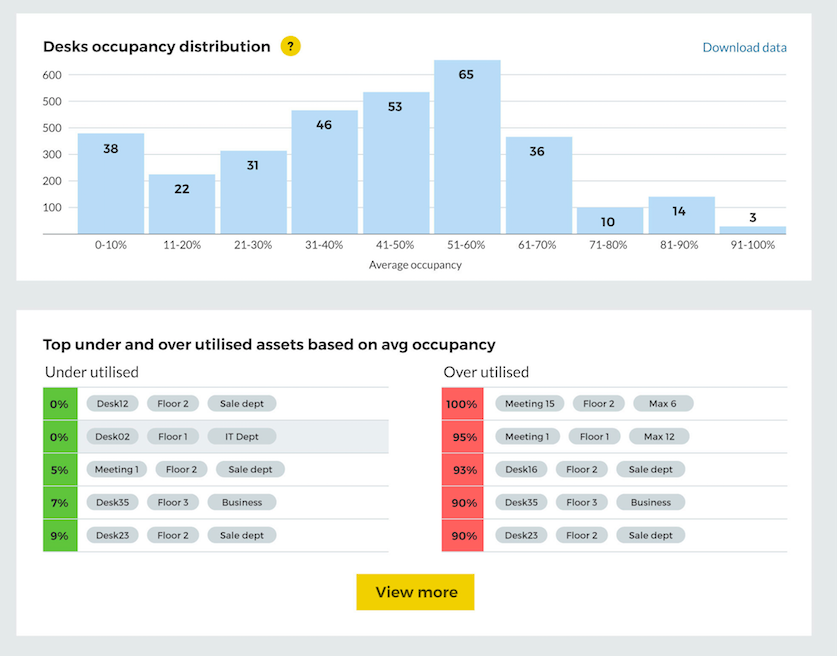
The real question is how the industry will balance the needs of it’s users, the people using the space with the need for maximum optimisation. Site managers have to weave a balance between underutilised offices, where the industry norm is >50%, and over utilisation where people can’t find space to work.

office-1516329__480

We all agree that half empty spaces are a waste of both money as well as having a significant carbon impact. Did you know that buildings currently account for 40% of all carbon emissions in North America?.

Local site managers should have plans for occasional overflow space when a company or team all have events, keep a sharp eye on real time utilisation metrics as above 85% has the potential to negatively impact the productivity and happiness of the people using the space. The goal most organisations we deal with are setting is to keep average utilisation within healthy 70-80%.

A connected workforce

It’s no secret that the changes we are seeing have a ripple effect in changing people’s behaviour. Technology is enabling people to work from anywhere in the world without the need to be in a fixed location, the ability to have online collaborative platforms means we are more connected than ever before.

This shift is having an domino effect on owners, occupiers and managers as they realign space occupancy strategies, flexible contract terms and environmental conditions to maintain and accommodate a changing workforce.

Deloitte-Millenial-Study-2018-callout

In the 2018 Emerging Trends in Real Estate study by PWC, it found many businesses were already using data to improve decision making as well as hiring environmental scientists to support customer demand and investment analysis.

Customer outcomes are fast becoming a primary driver of value as Real Estate grows into a service rather than a passive asset.

The growing need for analytical skills

Whilst technology is clearly changing the state of play in Real Estate, having analytical capabilities is a growing trend for Facilities and Corporate Real Estate within their daily jobs. More and more Facilities and Corporate Real Estate teams are required to provide factual base evidence – have the ability to analyse data, spot patterns or trends and turn this insight into strategies that will drive work space improvements.

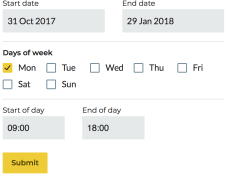
Facilities and Corporate Real Estate teams need solutions that will help them do this efficiently without having to spend hours sifting through layers of spreadsheets and systems. Some companies have adopted the use of sensors coupled with analytics to track how desk and floor space is used in real time. This has allowed them to make evidence based design and management decisions, saving millions in lease expenses.

Take Procurement teams as an example where only a few years ago the traditional approach to purchasing was the norm. Technology and data has transformed the way they operate, moving away from cumbersome in house systems to cloud based solutions that provide greater efficiencies, visibility of spend and cost savings across the business. The flexibility and accessibility of cloud solutions means Procurement teams are able to seek, source and recruit quality suppliers easily and  with data driven insights now the norm to justify investment business cases.

yodit-stanton-post_1200x675_hero_focus_0717

For Facilities and Corporate Real Estate teams wanting to embrace this new era, there are less than a handful of suppliers who offer an end to end managed solution; and who are doing it well.

We’ve helped many large companies including Arup, Pramerica, TripAdvisor and Firmenich transition change and maximise their workplace occupancy  by quickly helping them:

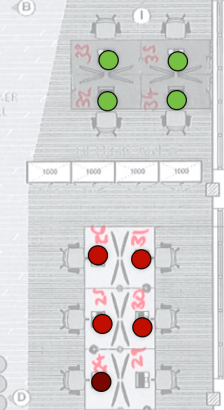
  • See how meeting rooms are being used
  • Accurately measure person to desk ratio
  • Find space for new staff
  • Benchmark with real data
  • Plan desks or overflow buffers
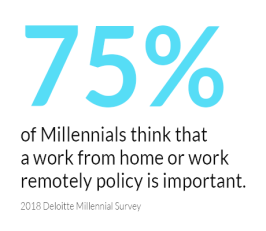
  • Pinpoint peak hours and encourage work from home

By making analysis and reporting the easiest part of the job, we proactively interpret and provide recommendations for improvements to give customers the complete picture of space occupancy. Find out more about our workplace utilisation data software or speak to an adviser.

5 easy changes to increase desk occupancy

Most facilities and workplace managers conduct regular workplace utilisation surveys of desk usage either using manual counting or desk sensors. Reports generated from these show granular information about the average as well as peak utilisation of desk utilisation.

There are some easy wins to increase desk utilisation in your office.

1. Turn all desks used 0-20% of the time into hotdesking

Screen Shot 2018-01-31 at 10.20.21
Figure 1: occupancy distribution chart

Looking at your desk occupancy distribution chart (figure 1), we quickly identify the specific numbers of desks that are used 0-20% of the time over a given period. These desks can easily be repurposed as flexible working desks, without risking overutilisation.

Additionally, we identify that 10 desks are used 20-40% of the time. Allocating at least 5 of those desks to flexible desking will still give you enough desks.

2. Increase teams’ person to desk ratio

By tagging specific teams on your floor plans, you are able to view their utilisation rates and benchmark their performance.

Screen Shot 2018-01-29 at 08.47.35
Figure 2: average and peak desk occupancy


In figure 2 it’s clear that this team has over 50 desks which are severely underutilised. The metric ‘peak occupied’ highlights that no more than 56 desks were utilised at the same time in the specified period.

3. Have better conversations with business unit leaders

With more accurate data in hand you can have better conversations with business unit leaders on how many desks they actually need. The conversations will shift from ‘how many desks do you need’ to ‘how can you use your space more productively’.

4. Use soft seating as overflow buffer

Occupancy heatmap
Figure 3: floor occupancy heatmap

When looking at floor level heatmap data (figure 3), it’s easy to see which desks that are located near highly utilised areas.  If for instance the green areas are soft seating, and the red areas hotdesks, you can safely optimise for very high desk occupancy rates (>80%). If all desks are full, employees can flow over to the soft seating. Caveat: this assumes good design where employees are as happy to work in alternative seatings as with desks.


5. Identify peak days and encourage work from home

Screen Shot 2018-01-29 at 09.28.07
Figure 4: calendar view

Using the calendar function (figure 4), you can identify patterns at specific points in time. For instance, you can recommend employees to work from home on particularly busy days.


Screen Shot 2018-01-29 at 09.29.15
Figure 5: trendlines for all Mondays

Figure 5 shows the pattern of utilisation for all Mondays over a 2 month period. We clearly see that the space is severely underutilised every Monday.


Smart Building Sensor Network Deployment Checklist

At OpenSensors, we have acquired much knowledge in planning, conducting, and managing real-world sensor network deployments.  Our checklist is based on our experience with field deployments. We have found the checklist to help manage the following risks:

  • Site specific risks: gateway/sensor placement for signal quality, ensuring connections with gateway has been established, ensuring gateways connect to cloud
  • Prepare risk – staging to verify design
  • Maintenance risk  – detecting sensors that have failed (e.g. stopped transmitting)
  • Connectivity of network, connectivity from gateway to cloud, deploying – setting up staging, maintenance – keeping the data flowing
  • Scoping process – identify and ensure impact on key KPIs


Site specific checklist

  • Gather CAD drawing or floor plan
  • Plan gateway placement
  • Identify any mounting and placement issues
  • Test building corners for signal quality
  • Confirm gateway locations and pre-installation requirements with onsite contacts 

Staging checklist

  • Order sensors and gateways
  • Develop schedule
  • Plan deployment rollout: floor by floor
  • Plan for safe storage
  • Plan and implement staging to pre-configuring gateways and sensors
  • Assemble Project Kit with all hardware (inc adhesives, screws, mounts, etc) 

Connectivity

  • Connect gateways and test connectivity using some sensors
  • Test remote access to the gateway
  • Mount gateways into position and document
  • Test end-to-end network connectivity with a few sensors

Implement

  • Deploy sensors according to the rollout plan
  • Test end-to-end

Handover

  • Prepare handover documentation with asset register
  • Review visualisations

Case Study: Technology Company Managing Desks

A Regional Manager for Office Experience at a fast growing technology company found himself getting increasingly frustrated by the unending demands for more space but equally by seeing the space half empty most of the time. Mark had the insight to use sensor technology to minimize the currently very expensive real estate costs and looked for data to help manage and plan prime floor space for their rapidly growing company.

He wanted hard data which would help him solve the problem of “how much space do I need?” in a less political and more objective approach. His situation was made more complex by having accrued a number of companies over the years, all with their own separate real estate contracts. Both legacy leasing and new real estate plans were based on more guesswork than real data. It was particularly important to take guesswork out of occupancy as these contracts were going to impact them for the next 10 to 15 years.

OpenSensors worked with Mark’s team and Stuart Imhof from Resource At Work to specify and install two types of sensors: desk sensors and meeting room sensors. The desk sensors are passive infrared sensors (PIR) that are triggered by both motion and heat,  providing  real-time 1:1 space utilisation. Initially we did a pilot with 5 devices but currently they have over 200 desk sensors over 6 floors. Our dashboards display usage per desk and an aggregate of the usage over the floor.

Screen Shot 2017-11-22 at 09.38.48

Example: key metrics for desk and meeting room occupancy

The meeting room sensors count the number of people using individual meeting rooms. OpenSensors dashboards display usage per meeting room and also per floor of usage. Now when Mark’s team gets complaints that there aren’t enough meeting rooms, they can dig into the problem and find a workable solution. After installing the meeting room sensors, the team learned that whilst the meeting rooms were used a lot, it was by individuals. As a direct result of this insight, they’re doing a refit and they’re adding some kind of individual space where people can make phone calls. Another thing that the team learned was that many people would book the meeting rooms but not use them leaving them unoccupied.

Screen Shot 2017-11-22 at 09.37.50

Example: Desk occupancy distribution chart and under- and over utilised facilities

Negotiating with the business units

With desk sensors, Mark quickly identified that initial desk utilisation was 36%. With these numbers in hand, the team was able to negotiate with the business units and drive up the utilisation. Mark noted that the data from the sensors helped align the business unit leaders’ goals and costs resulting in better space utilisation without additional cost.

Refit plans

The sensors not only enabled better management of space planning, but provided Mark and the facilities team knowledge to develop a needs-based refit plan. Based on meeting room usage, the team was able to add more individual space and free up meeting rooms for large groups.

Sensor deployment process

Initially deployment planning starts with CAD drawings, location data and floor information from the client. From there, we start making decisions about gateway placements and also tying the sensor IDs to the drawings.

Next, OpenSensors along with our installation and maintenance partner, Stuart Imhof from Resource At Work, visited the client’s site for a site assessment where we put up the gateways, and tested for signal quality on a floor-by-floor basis. During the site assessment, we walk the perimeter of the buildings, ensuring that we have strong signal strength.

Prior to deployment, we do as much prep ahead of time as is possible, so that when we arrive on site, the sensors are turned on, installed and we can quickly identify if the sensor has successfully joined the network. Our aim is to have very little configuration on site in order to ensure the least disruption to employees.  For more information on our deployment processes, check out our recent blogpost where our Project Manager, Kevin Mugadza, shares his experiences.

Impact

Overall, OpenSensors and Resources at Work have been successful partners for Mark and his team, enabling them to improve and fully understand space planning management. The OpenSensors space occupancy dashboards allow the team to streamline their work and ensure support for all business units.